Research article
Research article
Rodriguez Rey, Julio ⓘ
Universidad Nacional de Tucumán, Facultad de Ciencias Exactas y Tecnología,
Centro de Innovación Tecnológica CENIT
González, Matías ⓘ
Facultad de Ciencias Exactas y Tecnología,
Centro de Innovación Tecnológica CENIT
Universidad Nacional de Tucumán, Argentina
Parajón, Hernán Augusto ⓘ
Facultad de Ciencias Exactas y Tecnología,
Centro de Innovación Tecnológica CENIT
Universidad Nacional de Tucumán, Argentina
Palma, Ricardo Raúl ⓘ
Facultad de Ingeniería,
Universidad Nacional de Cuyo, Argentina
Adoption of the Logistics 4.0 paradigm has become a key determinant of global competitiveness. However, in emerging regional economies, the gap between available technology and its effective implementation remains a critical challenge. This paper aims to diagnose the level of technological maturity in the logistics processes of a group of Small and Medium Enterprises (SMEs) in Northwest Argentina (NOA), analyzing the structural barriers that limit their digital transformation. A descriptive, quantitative study was conducted on a multisectoral sample of regional companies. For data collection and analysis, a technological maturity assessment matrix was designed based on proven models in the discipline. Logistics process management is categorized into four incremental evolutionary stages: (1) Manual/Analog, (2) Basic Digitalization, (3) Isolated Systems, and (4) Integrated Automation. The analysis reveals a marked asymmetry in modernization. 74.1% of companies are concentrated in the lower levels. Only a small sector reaches level 4 of systemic integration. Sectorally, the export-oriented agribusiness shows higher rates of digital traceability, while the commerce and construction sectors exhibit significant lag in their processes. The findings confirm that the main barrier is not only financial but strategic: there is a prevailing investment culture biased toward physical machinery at the expense of data intelligence.
Background: The consolidation of Logistics 4.0 has become a central factor for competitiveness in contemporary supply chains. However, its effective adoption by small and medium-sized enterprises remains uneven, particularly in emerging regional economies.
Gap: This article addresses the gap between the availability of digital logistics technologies and their actual incorporation into business processes in SMEs located in the Argentine Northwest.
Purpose: The objective of the study is to diagnose the level of technological maturity of logistics processes and to identify structural and organizational barriers that limit digital transformation.
Methodology: A quantitative and descriptive methodology was applied, based on the development of a technological maturity assessment matrix and its application to a multisectoral sample of SMEs.
Results: The results reveal that a significant majority of firms remain concentrated in low maturity levels, characterized by manual or basic digital processes, with limited integration and automation. The findings suggest that technological lag is not exclusively linked to financial constraints, but also to strategic and cultural factors that prioritize physical assets over digital capabilities.
Conclusion: The study concludes that advancing toward Logistics 4.0 requires not only technological investment, but also organizational change and managerial awareness regarding the role of data and systems integration.
Supply chain management is undergoing a paradigm shift driven by the so-called "Fourth Industrial Revolution." In this context, logistics has ceased to be merely an operational and support activity to become a strategic factor of competitiveness. Current literature defines Logistics 4.0 as the integration of digital technologies—such as Internet of Things (IoT), Big Data, Cloud Computing, and real-time traceability systems—aimed at improving efficiency, flexibility, and transparency of material and information flows (Yoguel et al, 2021; CEPAL, 2020). There is academic consensus that digitalization is imperative for survival in globalized markets. However, various authors point out a significant gap between the availability of these technologies and their effective implementation in emerging economies (CAF, 2020), resulting in uneven adoption scenarios depending on company size and capacity.
In Argentina, there are multiple obstacles to technological implementation in the various productive and service processes carried out by SMEs. Many of these obstacles are due to structural issues such as macroeconomics, lack of confidence, inflation, and other factors that are largely beyond the control of the company or organization seeking to adopt new technologies. However, at another level, many adoption barriers fall within the organization's sphere of action, even if many stem from the macro issues described above. The lack of a long-term investment horizon leads managers to hesitate regarding the magnitude and direction of resource allocation. Nevertheless, in recent years, some issues have become unavoidable, especially in supply chain management, as operations are shared with larger and more technologically advanced players, such as major international suppliers or the state itself, with technologies that inevitably require the implementation of more advanced stages in transactional models (Vélez & Morero, 2024).
According to the definition and regulatory framework in Argentina, Small and Medium Enterprises (SMEs) are defined as independent, non-subsidiary organizations operating below certain dimensional thresholds. The official classification distinguishes between Micro, Small, and Medium Enterprises based mainly on total annual sales volume (with specific caps by sector, such as industry or mining) and current regulations. Operationally, the sector is also often defined by staff size, typically ranging from 6 to 200 employees, including firms whose employment levels fluctuate near these limits (Díaz & Pérez, 2021). This business sector is characterized by marked heterogeneity. While there is a subset of dynamic and innovative companies—especially in manufacturing, where flexibility allows rapid adaptation—it is essential to understand that SMEs should not be analyzed simply as "large companies on a smaller scale." Unlike large corporations, these organizations do not usually benefit from economies of scale, strict division of labor, or highly formalized processes. Their competitiveness depends instead on differentiation strategies to overcome development limitations. The business environment of an SME is strongly conditioned by external factors such as regulatory frameworks, macroeconomic policies, and industrial strategies, so their survival and consolidation often require specific support, especially in technological processes (Beltramino & Fink, 2025).
Regarding export performance and regional disparities, SMEs are considered a key driving force for economic growth and job creation, although their performance shows strong geographic asymmetries. The highest concentration of companies is historically in the Pampas and Central regions. In terms of foreign trade, there are notable differences in export profiles by location. While a higher percentage of industrial SMEs in the metropolitan area (AMBA) manage to export a significant portion of their sales compared to regions like Cuyo or the South, NOA (Northwest Argentina) and Patagonia are the regions that have recorded the highest average export amounts per firm. Although sector exports have shown periods of growth in average value per company, volumes remain much lower compared to large manufacturing companies, which can export dozens of times more than their medium and small counterparts (Ministry of Productive Development of the Nation, 2021).
The Northwest region generates approximately 6% of GDP, with only two provinces exceeding 1% of GDP: Salta and Tucumán, which approaches 2%. 17% of the region's contribution to GDP comes from industry, mainly food, textiles, and metalworking. The food sector stands out for sugar, citrus, soft drinks, dairy, and wine. Tucumán is the main sugar producer, with the largest and most productive crops, hosting 65% of the country's sugar mills. The importance of sugar production for Tucumán is such that it accounts for more than half of its industrial output. Santiago concentrates 21% of total cotton. Around 350 industrial SMEs operate in Tucumán, mainly in Greater San Miguel de Tucumán, with 88% having fewer than 50 employees (Rodriguez Rey, 2023). In Northwest Argentina (NOA), the general problems of SMEs are exacerbated by regional factors. This area faces a "double periphery": geographic (distance from ports) and technological (Ascúa, Dini & Morero, 2024).
Academic and technical reports on NOA (CFI, 2022) have tended to focus on macro logistics (road infrastructure, bioceanic corridors), neglecting the analysis of "domestic" or internal logistics processes within companies and local value chains. Local studies suggest that lack of connectivity in interior industrial zones and the limited local supply of technology providers further slow technology adoption compared to the central region of the country (Rodriguez Rey, 2023).
Unlike large corporations, where logistics is managed from an integrated Supply Chain Management perspective, SMEs often have a fragmented approach. Literature indicates that, in this segment, logistics activities are frequently seen as an unavoidable cost center rather than a source of competitive advantage (Ascúa R.A., 2021). There is commonly a lack of formalization in processes: many SMEs lack a defined logistics area, with responsibilities diluted between production and sales. This "ad hoc" or reactive management leads to recurring problems such as stockouts, inventory obsolescence, and errors in order picking. Management often focuses on resolving daily urgencies rather than strategic planning of flows (Rodriguez Rey et al, 2023).
Companies may have accounting software disconnected from warehouse management, requiring manual data duplication and increasing human error. There is also a high dependence on basic office tools (spreadsheets) for critical processes, limiting scalability and real-time data analysis (Alderete, 2019). Technology management in SMEs has particularities related to resource scarcity and organizational culture. Generally, the incorporation of ICTs does not follow a strategic plan but occurs reactively. The technology management system can be considered an integrated set of processes and activities used by a company to improve its technological competitiveness (Rodríguez Rey et al, 2023). A system consists of interconnected, interdependent, and interactive elements to achieve an objective. Technological resources can be managed through activities such as acquiring, developing, collecting, sharing, applying, and protecting technological resources. This includes tangible resources, such as equipment and funds, and intangible resources, such as personnel, information, and research results (Krawczyk-Dembicka, 2017).
The decision to implement specific technologies (WMS, TMS, RFID) is conditioned by several factors acting as barriers or drivers, as modeled in various technology adoption studies.
Barriers: The main barrier is financial (acquisition and maintenance costs), followed by cultural and organizational barriers, such as staff resistance to change, lack of technical training ("talent gap"), lack of technological vision from management, lack of organizational support, challenges in adopting new technology, and lack of government support (Shaikh et al 2024).
Enablers: Adoption is facilitated by "supply chain pressure" (demands from large customers) and technological democratization through Cloud Computing and SaaS (Software as a Service) models, which reduce the initial investment required (CEPAL, 2021). Technology adoption is currently much more demanded in SMEs, and after COVID-19, the intensity of this adoption has increased considerably. Literature suggests that managers face various challenges and obstacles in technology adoption, such as data security, low technical qualification, efficiency, high infrastructure costs, training costs, adoption difficulties, less government support, less organizational support, local sources, administrative challenges, attitude problems, and others (Smidt & Jokonya, 2022). The most frequent difficulties are high infrastructure costs, lower technical qualification and efficiency, less government support, adoption difficulties, and lack of organizational support (Shaikh et al, 2024; Shahadat et al, 2023).
A panel of 15 individuals working in logistics, all part of a specific training program in logistics and Industry 4.0, was contacted. Their knowledge was validated as they had completed a semester of specific topics and passed exams satisfactorily, so they are considered knowledgeable about logistics processes and technologies in their companies. A literature review was conducted regarding maturity determination in logistics processes.
To operationalize the diagnosis of the technological level in NOA SMEs, an evaluation matrix was designed based on an evolutionary approach to digital transformation. This categorization is based on the premise that Industry 4.0 is not an isolated or sudden technological implementation but the result of a cumulative process of capability maturation. Following the theoretical guidelines of Schumacher et al. (2016), maturity is understood here not as a binary state (having or not having technology), but as a gradation of "readiness" encompassing both technological and organizational process dimensions. The conceptual model adopted for defining the four levels of the matrix aligns with the Industry 4.0 Maturity Index proposed by Schuh et al. (2017). The author states that, before reaching true operational intelligence, organizations must go through previous stages of digitalization. Thus, Level 1 (Manual/Analog) represents the pre-digital stage, where data capture is physical and asynchronous, preventing any real-time analysis. The transition to Level 2 (Basic Office Tools) corresponds to the "Computerization" stage described. In this phase, digital tools (such as spreadsheets or isolated accounting software) replace paper, but data remains stagnant in what literature calls "information islands." Although digitalization exists, there is no process integration, limiting management to a fragmented view. The qualitative leap to Level 3 (Integrated Systems) marks the threshold toward "Connectivity," identified by authors as the indispensable prerequisite for Industry 4.0. Here, implementing ERP (Enterprise Resource Planning) or WMS (Warehouse Management Systems) breaks information silos, creating a unified "digital shadow" of physical processes. Technology ceases to be a recording tool and becomes a transactional management platform. Finally, Level 4 (Advanced/4.0 Technology) encompasses the upper stages of the Acatech model: "Visibility," "Transparency," and "Predictability." At this stage, integrating disruptive technologies (IoT, Big Data, Artificial Intelligence) enables not only real-time awareness but also anticipation of future scenarios. As suggested by Schumacher et al. (2016), at this level, technology enables decentralized and autonomous decision-making, achieving dynamic optimization of logistics resources. This stratification allows each SME to be placed at a precise point in its evolutionary trajectory, identifying not only technical shortcomings but also structural barriers preventing advancement to the next maturity level. Effective management of technological resources can significantly improve a company's technological performance and overall results, depending on how the organization uses technology (Imtiaz et al, 2020).
Table 1: Classification of Logistics Activities by Technological Maturity Level
Logistics Activity |
Level 1: Manual/Analog |
Level 2: Basic Office Tools |
Level 3: Integrated Systems |
Level 4: Advanced/4.0 Technology |
Procurement & Purchasing |
Verbal or phone orders. Recorded in physical notebook/agenda. |
Requests via email. Tracking in Excel disconnected from stock. |
Purchase Orders (PO) issued in ERP. Automatic impact on forecasting. |
Automated B2B portals. Automatic replenishment (VMI) based on data. |
Goods Reception |
Visual check against paper delivery note. Manual signature and physical filing. |
Manual data entry (typing) in PC/Excel hours after unloading. |
"Blind" verification against PO in ERP system in real time. |
Automatic reading (RFID) or mass scanning for immediate entry upon dock crossing. |
Inventory Management |
Periodic physical count (annual). Control on paper cards (Kardex). |
Spreadsheets updated periodically (time lag). |
Stock module in ERP (deducts with sale, adds with purchase). |
Real-time monitoring with IoT sensors. Perpetual and predictive inventory. |
Warehouse Management (Location) |
Location based on operator memory. "Organized chaos." |
Warehouse map on paper/Excel. Basic alphanumeric coding. |
Basic WMS: System assigns and records exact pallet location. |
Intelligent WMS: Dynamic optimization (ABC), routing algorithms, automation. |
Order Management |
Order taken at counter, phone, or voice note. Paper slip. |
Received by email. Manual entry (typing) in billing system. |
Entry via E-commerce/Sales App. Direct impact on central system. |
Electronic Data Interchange (EDI) between client-supplier systems without human intervention. |
Order Picking |
Route with paper list and pen. Search based on memory. |
Printed picking lists ordered by logical route or aisle. |
Use of handheld terminals requiring scan to confirm item. |
Voice Picking (voice instructions), Pick-to-Light (lights), or collaborative robots. |
Dispatch |
Visual count when loading. Manual preparation of delivery note and route sheet. |
Checking off on printed paper. Delivery note generated by system. |
Scanning of finished packages to validate against Route Sheet before closing. |
Automatic validation (weight/volume/RFID). Automatic dispatch notification to client. |
Transfer between warehouses/plants |
Verbal instruction and paper transfer slip. |
Record in shared spreadsheet (Drive/Excel) of departures and arrivals. |
"Logical transit" in system: goods appear "in transit" until received at destination. |
Asset traceability (pallets/containers) via tags and internal geolocation. |
Client Transport (Distribution) |
Manual route sheet prepared by driver. Phone confirmation. |
Static routing (fixed zones). Passive tracking by vehicle GPS. |
TMS (Transport Management System) to optimize load and dynamic routes. |
Electronic Proof of Delivery (ePOD), digital signature, and real-time tracking for client. |
Just-in-Time Production (JIT) |
Simple visual signals or verbal request ("input ran out"). |
Physical Kanban cards (cardboard) traveling from station to warehouse. |
MRP/Production scheduling triggering internal orders by shifts. |
e-Kanban (digital signals). Inline sensors trigger automatic replenishment at critical stock. |
A panel of experts, composed of faculty members and consultants affiliated with the Industrial Logistics Department at the National University of Tucumán, was convened to determine the questions to be addressed. In this instance, the focus was on identifying the various stages of the Supply Chain, in order to ensure the recognition of the technological elements involved in logistics. This approach was necessary because these processes are often vaguely identified as related to logistics, or sometimes not associated with logistics at all. At the time the expert panel was conducted, the companies had already been identified and a preliminary description of each had been provided by the interlocutors, who would later respond to the final questions through structured surveys. (Shahadat et al, 2023)
The questionnaire was designed to collect, in a clear and concise manner, the essential information that constitutes the objective of this study. Special attention was paid to its structure and to drafting it in a straightforward and accessible way, aiming to minimize potential issues when deploying the questionnaire. Its design was based on a review of the existing scientific literature on the various aspects under investigation, as well as prior knowledge of the companies’ realities, which supports and justifies the relevance of the variables included to achieve the stated objectives. (Bonaga Y. 2024), (Vélez & Morero, 2024)
The methodological approach selected for this study falls within the framework of qualitative-quantitative research, or mixed methods, a robust strategy that seeks data triangulation and complementarity. This approach recognizes that the inherent complexity of management and administrative phenomena requires both the precision of quantifiable data and the contextual richness of narratives and perceptions. (Sardana et al, 2023)
According to specialized literature on research methodologies, and as highlighted in the literature, the interview constitutes one of the fundamental and most established strategies for collecting data of an eminently qualitative nature. The interview is regarded as both an art and a science, given its unique capacity to access the meanings, experiences, and motivations of participants. It is important to note that, due to the diversity of disciplinary perspectives (sociology, anthropology, psychology, and management sciences), a wide range of qualitative interview strategies has emerged, resulting in significant methodological variation in their application and scope (Barroga et al, 2023). A crucial distinction in this context is drawn between interview methodologies. On one hand, there are highly structured interviews and surveys or closed questionnaires, frequently used in disciplines such as epidemiology, where the main objective is the precise measurement of variables and statistical generalization. In these cases, the interviewee is conceived, almost literally, as a conduit through which objective and predefined information is retrieved. On the other hand, and in direct contrast, qualitative research favors less structured interview strategies. The adopted qualitative-quantitative approach thus enables in-depth exploration of perceptions through unstructured and semi-structured interviews, while ensuring rigor and statistical analysis capability through the collection of quantitative data in specific segments, such as financial analysis or demographic characterization of companies. The methodological design benefits from the synergy between both approaches to build a holistic understanding of the phenomenon under study.
Within the spectrum of qualitative tools, semi-structured interviews represent a format of crucial importance, offering a methodological balance between the rigidity of structured interviews and the complete fluidity of unstructured ones. The main operational difference with unstructured interviews lies in their context of application: while the latter are often conducted in conjunction and in real time with participant observation data collection (seeking spontaneity and natural context), semi-structured interviews, in many qualitative research projects, constitute the sole primary source of data and, therefore, are usually planned and scheduled in advance. This prior planning is a reflective process on the part of the researcher, involving the anticipation of possible impacts, emotional reactions, or sensitivities that may arise during the dialogue. Preparation not only ensures coverage of essential topics but also establishes a rigorous ethical and logistical framework (Barroga et al, 2023).
The intrinsic and distinctive characteristics of qualitative data collection methods, so focused on depth and contextualization (as used in management sciences), are necessarily reflected and replicated in the methods employed for analyzing those same data. The most defining feature of this analysis is its predominant focus on textual and discursive responses, as opposed to the numerical or statistical responses typical of quantitative analysis. The central method for processing this material is qualitative content analysis. This is established as a rigorous research method aimed at the subjective interpretation of the content of textual data (Vu, T. T. N., 2021).
Technologies reported in Annex C were categorized into four levels of technological maturity, allowing visualization of the existing technological gap. Based on processed records, the distribution of technological level in current company processes (Annex A) is as follows:
Table 2. Maturity Level Achieved by Companies in the General Panel
Maturity Level |
Technologies Detected (Examples) |
Observed Frequency |
Detected Values |
Level 1: Manual/Analog |
Manual record, Conventional transport, Paper, Human judgment |
Very High |
46.3% |
Level 2: Basic Digitalization |
Spreadsheets, Excel, Worksheets |
High |
27.8% |
Level 3: Isolated Systems |
Proprietary software, Accounting systems, Proprietary apps |
Medium-Low |
13.4% |
Level 4: Automation/Integrated |
Semi-automatic equipment, Integrated ERP, WMS |
Low |
6.1% |
Strong Presence of Manual Management and Digital Informality (Levels 1 and 2): Statistics show that nearly 75% of current logistics processes (sum of Levels 1 and 2) depend on direct human intervention and are not integrated into robust management systems. The term "Manual record" is the most recurrent in terms of use. This implies a high risk of human error, data loss, and a lack of "Quality Data" needed to feed AI algorithms in the future. "Spreadsheets" act as the main digital support, indicating incipient but fragmented digitalization (information silos).
Sporadic Presence of Modernization Initiatives (Level 3): "Proprietary software" and "Apps" are present in specific medium to large companies. However, these are software implementations that do not qualify as comprehensive ERP systems. In most cases, there is a lack of interoperability. Data exists but does not flow automatically between departments.
Incipient Automation Focused on Main Processes: In the few cases of Level 4, these correspond to "Semi-automatic equipment" (hardware) rather than intelligent software. This suggests that local companies invest first in physical production machinery rather than data intelligence or logical supply chain integration.
Otro aspecto interesante para analizar es cómo varía la madurez tecnológica entre los distintos sectores industriales o de servicios. El entorno sectorial influye fuertemente en las necesidades de adopción tecnológica en los diferentes procesos, ya sea por las actividades propias del sector o por la intensidad competitiva. El siguiente análisis visualiza cómo el sector impacta en la madurez tecnológica. La Tabla 3 muestra el porcentaje de procesos logísticos de cada sector en cada nivel tecnológico.
Tabla 3: Nivel de madurez promedio por sector
Sector |
Level 1: Manual/Analog |
Level 2: Basic Digitalization |
Level 3: Isolated Systems |
Level 4: Automation/Integrated |
Agroindustrial |
23% |
30% |
40% |
7% |
Construction |
56% |
24% |
12% |
8% |
Retail |
59% |
36% |
5% |
0% |
Manufacturing |
34% |
41% |
18% |
7% |
Services |
22% |
53% |
23% |
2% |
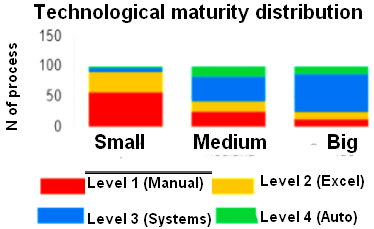
As expected and widely supported by the literature, small enterprises operate almost entirely at maturity level 1 (manual). SMEs with between 50 and 150 employees, while still maintaining a large proportion of their processes at level 1, begin to implement digitalization through office tools such as spreadsheets, corresponding to level 2. On the other hand, large companies maintain a minimal number of processes at levels 1 and 2, and practically concentrate all their processes at level 3 (information systems), also implementing, to a lesser extent, automation in data collection and processing, corresponding to level 4.
The analysis shows that the Agribusiness sector is the most advanced in terms of technological maturity, with better relative performance (greater presence in Levels 3 and 4). Among the possible causes, we can mention the export profile, which is highly prevalent in this sector and imposes international traceability standards (Global G.A.P., phytosanitary regulations) that require abandoning paper-based processes. As evidence, it is known that this is the only sector where the use of systems related to strict and automated controls of dates, expirations, location, and especially traceability software, surpasses Excel and office applications.
Duality in the Construction and Manufacturing Sectors: Here, an interesting phenomenon of "Islands of Automation" is observed. These companies show a high degree of maturity (Level 4) in the Production stage, for example, through the acquisition of state-of-the-art equipment, but fall drastically to Level 1 (Manual) in Logistics and Warehousing. It can be inferred that there is investment in physical machinery due to the fact that the greatest weight of production costs lies in these processes, but there is a critical lag in management software. Logistics continues to show low performance in terms of technological maturity.
Low Performance in the Retail Commerce Sector: This commercial sector shows the lowest performance, with almost 95% of processes concentrated between Manual and Excel levels. Operating mainly in the domestic market (B2C) and being family businesses/SMEs, they do not perceive the return on investment of complex logistics software. Their "maximum technology" is usually the fiscal invoicing system, disconnected from real stock control.
When analyzing the expected benefits of implementing new technologies, the distribution of expected benefits is as follows: Performance (47%): This is the dominant category. Most companies seek technology to improve quality, reduce errors, and achieve traceability (especially exporters and manufacturers). Efficiency (35%): Highly sought after by the productive and construction sectors to reduce operating costs. Agility (18%): Mainly valued by the Commerce sector (quick customer service) and in managerial decision-making.
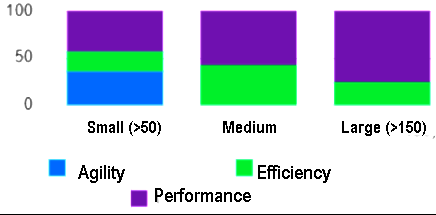
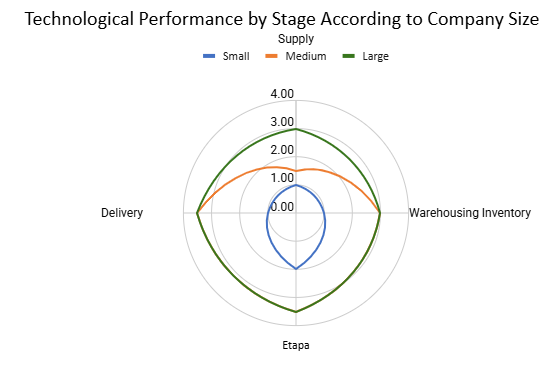
Again, it is important to understand what would happen with the expected benefits of technology adoption across different sizes of small and medium-sized enterprises analyzed. It is well known that technology helps processes in terms of security, efficiency, and effectiveness, as well as expanding communication possibilities with clients and suppliers, generating strategic options that would hardly be viable without proper implementation of technological systems. Regarding company size, these priorities change, and it is interesting to analyze which priorities are sought in each of these segments. The chart reveals very clear behavioral patterns:
Small SMEs: They are the only segment with a significant portion of Agility (blue color). With limited resources and a dependence on "day-to-day" operations, they prioritize tools that accelerate simple processes (such as QR codes for price reading or quick customer responses). They seek to "do it faster."
Medium SMEs: Here, the urgency for "Agility" disappears and the share of Performance (Quality/Traceability) increases, as these companies have sufficient volume for errors to be costly. They seek technology to better control their stocks and predict demand (Big Data).
Large SMEs: They are divided almost exclusively between Efficiency (Costs) and Performance (Traceability). With a strong export profile, "Agility" is not as critical as Certification. They plan to invest in Blockchain and AI not to be faster, but to guarantee absolute traceability and reduce large-scale operating costs.
It is particularly interesting to analyze how the degree of technological maturity behaves in relation to the main logistics macroprocesses, namely: Procurement and Reception, Storage, Production and Planning, and finally Distribution and Delivery. This phenomenon can be observed in Figure 3.
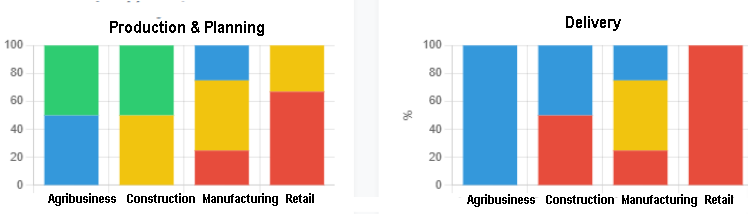
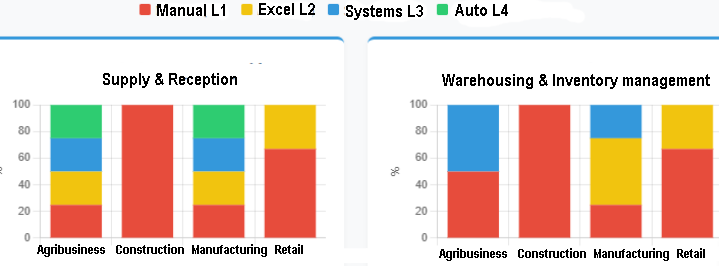
In the case of agribusiness, its storage and reception processes span virtually all maturity levels. When moving into the storage area, a strong degree of systematization is evident, likely due to the importance of traceability at this stage. In production and planning, this aspect becomes even more pronounced. Finally, in delivery, we observe the highest degree of technological maturity in the entire sample, probably because this process is subject to stricter control.
For companies in the construction sector, there is significant immaturity in procurement and reception, as well as in the construction process itself. However, as the process approaches its most critical stage—construction itself—maturity begins to improve. This is likely due to the high impact of costs and savings at this stage. Finally, in customer delivery, both manual and systematized processes at Level 4 are observed. This is interpreted as the result of the dual nature of the goods produced by this sector: on one hand, a physical aspect, and on the other, a technical record (plans and related documents), which are usually fully digital.
Regarding manufacturing companies, their processes show relatively even technological maturity throughout the entire supply chain, with only slight improvements in reception and procurement. This may be due to the importance of supplier interactions, which drive higher technological levels.
Finally, in the commerce sector, we see the lowest technological performance, with a particularly low presence in the distribution and delivery stage. This situation is associated with the high degree of tax informality in this final step, which leads to a deliberate absence of technology in this part of the process.
As shown in the presented radial chart, the performance of large SMEs (indicated in green) is significantly superior to that of small and medium-sized SMEs. Medium-sized SMEs perform similarly to large ones in production, warehousing, and distribution, with differences appearing in the procurement stage. This is probably because large companies interact with suppliers whose processes are more technologically advanced.
Finally, beyond overall performance, small SMEs perform relatively better in their production processes, which is usually due to the concentration of costs—and therefore efforts for technological adoption—in this area. This aligns with what was discussed in section 3.1 regarding the benefits sought by small companies, which mostly aim to improve performance and agility.
The analysis conducted on the sample of SMEs from Northwest Argentina (NOA) allows for a quantitative diagnosis of the state of technological maturity in regional logistics management. The results validate the existence of significant structural barriers to technology adoption in logistics processes. The main conclusions derived from the statistical evidence are detailed below:
Prevalence of Analog Management and Low Interoperability: The frequency distribution of maturity levels reveals a marked negative asymmetry. 74.1% of surveyed companies are concentrated in the lower stages of the scale: Level 1 (46.3% Manual/Analog) and Level 2 (27.8% Basic Digitalization). This indicates that three-quarters of the business fabric base their logistics operations on physical records or non-integrated office tools. The low incidence of Level 4 (6.1%), corresponding to automated and integrated systems, statistically demonstrates the difficulty local SMEs face in overcoming the interoperability barrier. Data fragmentation or "information silos" (Level 3, 13.4%) constitutes the current technological limit for most organizations that have begun technological investment processes.
Correlation Between Market Orientation and Technological Maturity: Sectoral analysis confirms a direct correlation between the degree of exposure to international markets and the level of technological implementation, in line with Carvache et al. (2022). The Agribusiness sector exhibits the highest maturity indicators, driven by exogenous traceability and certification requirements (export regulations). In contrast, the Commerce sector shows the poorest performance, with nearly 95% concentrated in levels 1 and 2. This suggests that, in the absence of external regulatory pressure or export logistics complexity, the domestic market does not generate sufficient incentives to justify the return on investment (ROI) in advanced management technologies.
Asymmetry in Investment: Production vs. Logistics: There is a significant discrepancy in technological maturity depending on the process type. While Production stages show higher levels of automation (especially in Manufacturing and Construction), Procurement and Distribution processes exhibit notable technical lag. This duality indicates a bias in investment decisions toward tangible capital goods (production machinery) to the detriment of software solutions for supply chain management. Logistics continues to be managed mainly under manual paradigms, acting as a bottleneck that limits the overall efficiency of the productive system.
Influence of Organizational Scale on Adoption Drivers: The data corroborate that company size is a predictor of technological behavior. A shift in "expected benefits" is identified as the organization scales: Among SMEs, the smallest (in terms of workforce) prioritize operational "Agility," adopting targeted, low-cost technologies. Those considered Medium and Large SMEs direct their investment toward "Performance" and "Efficiency" (47% and 35% respectively in the overall sample). This allows us to conclude that the adoption of comprehensive systems (ERPs, WMS) does not depend solely on financial availability, but on the critical need to control operational complexity and ensure data integrity at a larger scale.
Regional Synthesis: Finally, the study provides evidence of the "double periphery" of NOA. To the geographic logistical disadvantages is added an internal digital gap: the dependence on manual processes in 46.3% of the sample prevents the generation of quality transactional data (Data Quality). Without this digital foundation, the region faces a structural limitation to integrating emerging optimization and prediction technologies, restricting its competitiveness in value chains that demand real-time digital traceability.
Article
Technological Maturity Analysis in Logistics Processes of Tucuman SME
Publisher:
Journal: Técnica Administrativa
Volume: 25 , Number: 2, Order: 1 ; ISSUE: 106
Date of publisher: 2026-04-15
URL: www.cyta.com.ar/ta/article.php?id=250201
License: Atribución 4.0 - Internacional (CC BY 4.0)
© Ciencia y Técnica Administrativa
Registro ISSN: 1666-1680
Primera instancia: Curación académica realizada por CyTA, según criterios de integridad científica, semántica y estructura académica (disponible a partir de 2024/07).
Segunda instancia: Curación asistida por inteligencia artificial (ChatGPT, desarrollada por OpenAI), mediante prompts especializados diseñados por CyTA (disponible a partir de 2001/09).
Este protocolo implementa un modelo de revisión abierta, responsable y trazable, centrado en la formación, la transparencia y la accesibilidad del conocimiento.
🎓 Academic Review contributed by: Torres Ponce, Mariano Enrique »
✨ Curation Assistant, GenAI contributed by: ChatGPT, Copilot, Gemini, Et al. »
Triples of the Data Model Semantic RDF »
To send article, send it to the email: editorialcyta@gmail.com or cyta@cyta.ar
Identify it, in the subject field, with the word: Article
In the body of the email, indicate the following information for each of the authors, name to be quoted, filiation, and email.
Técnica Administrativa se encuentra indexada en los siguientes directorios de publicaciones científicas: Scholar Google, DIALNET, ZDB, LATINDEX, WorldCat, Crossref, REBIUN, PURL, Ágora, Miar, BINPAR, entre otros.